Dashboard widgets - Advanced

September 2, 2022

Creating and adding widgets to your dashboard window can be done in several ways: choosing from the default options, customizing your own unique widgets or by coding the application independently. To learn in detail about Dashboard as a whole, read our Dashboard basics article.

In this article, you will learn:

Adding default widgets

Adding widgets from default is as easy as ABC! Just click on the ‘Setup’ button, go to any free space and hit the ‘Plus’ button. Now, simply choose the widget that you want to see on your dashboard.

adding widgets

You have the following options to choose from:

Average reply time

This widget will help you to stay updated on how fast your Leads are getting answered.

Note: The average is calculated by adding all data values and dividing it by the number of the data point. That’s why sometimes if one lead doesn’t get a reply for a significant amount of time, it can affect the whole value.

Pipeline report

This widget gives a snapshot of your sales pipeline. If you have multiple pipelines, you can select the one you want to view on the left.

It is very handy to have it on the top of your dashboard to have the general idea of how your sales are going.

The chart highlights the number of leads that make their way through the pipeline, as well as their success rate. Every element of the interface is interactive.

The ‘New’ at the beginning of the stage represents the Incoming leads stage. Next, you can see the stages and the number of the leads with the amount of the deals they have brought. Below the diagram you can see the ‘Lost’ number, accounting for every lead that was sent to Closed – Lost at that stage. The right-most block shows closed-won and closed-lost leads.

Pipeline report

When a lead is moved to another stage, the lead number and sale amount will be updated for both stages. This is done to present all current additions and subtractions in terms of lead number and budget.

Goals

This widget can be a great tool to monitor your goals.

Goals widget

To see your goals on the widget, you will need to set them up . For that, go to Stats > Goal report > Set goals. Here you have to choose the time period of the goals and specify the exact month or the period of the year.

Then you can enter the number of closed-win leads and the amount of deals you want to see by the end of the period. You may write goals separately to a single person or set it to the whole group which will be divided proportionally among the team members.

Set goals

Last uploads

The latest uploads made by any user are indicated in this widget. Files can be uploaded by attaching a file to a note, task or a chat message.

Last uploads widget

Prospective sales

This is a sales forecast, which is calculated based on the number of active leads and their total budget. With this forecast, you can see the approximate data on how many leads will be won in the coming days, as well as the value they have brought.

Data on this widget cannot be changed and the period of time that you have chosen does not affect it. But you can filter the information by managers or teams, or if you want to get more information on your sales, you can visit the ‘Statistics’ section of the Kommo.

Prospective sales widget

Net Promoter Score (NPS)

Here you can see the results for our Net Promotion Score bot. Once you finish a conversation you can send your client NPS bot to ask how likely they would recommend your business to their friends on a scale from 1 to 10.

The widget provides you with three average levels of satisfaction:

  • Promoters (9 to 10 score)
  • Passives (7-8 score)
  • Detractors (0-6 score)

Along with that, you can see the total number of responses and overall satisfaction rate, based on subtraction of the Detractor score from the Promoter score.

Nps widget

System usage

It is a way of observing the total amount of time your users have spent while using Kommo. It’s a decent way to monitor user activity.

You can choose any interval and the widget shows the results for this phase. For example, if you select the week period, it will show how much time users have spent in their account for this week (from Monday to the present time).

Do note, that system does not consider users to be online:

  • Once the system window is minimized or closed,
  • When switched to another webpage,
  • If a new application is opened in a full window,
  • If the internet is disconnected
System usage

Total conversations processed

This widget gives the sum of total conversations conducted in your account and respective numbers for each individual.

It is also important to note that the widget calculates the number of dialogues based on the number of managers taking part in conversation. That is, if the number of managers talking to the same client is two, the system considers it to be two different conversations.

Total conversations

Outgoing messages

In ‘Outgoing messages’ you can see the number of the messages sent by the users. They are also represented by being broken up into different messengers.

Outgoing messages

Average Response Time

This is a widget that displays the average response time to customer requests on a timeline. The calculation formula is sum / count – the sum of the time of all answers divided by the number of these answers.

The response time is calculated according to the formula: the date and time of our response minus the date and time of the previous client message.

The purple line displays the current (selected) time period and the gray line represents the same previous time period. Hovering over a time period, we see two white points by which we can drill down data for both time periods.

Note: Sometimes a graph may display a single sharp jump in the middle of the frame. This mostly occurs if the reply time for a conversation is significantly later than those of others. For example, if the response time of one of your dialogues is 12 hours and the rest is in minutes or seconds, they will be closer to zero than an hour and the graph presents them inside zero.

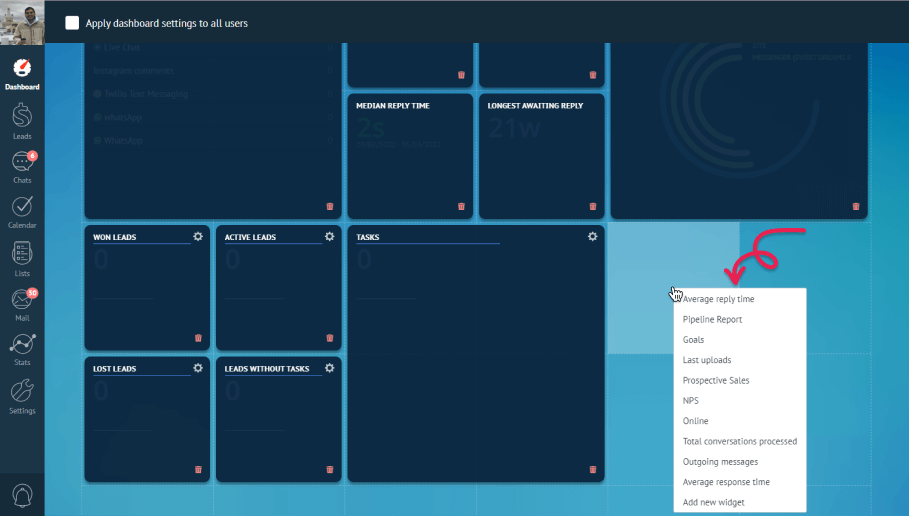
If you want a more advanced solution for monitoring your business, visit our Dashboard - Creating custom widgets article.

Need more help in setting up or troubleshooting? Contact us by sending an email to support@kommo.com or write to us on Facebook.

Not a user yet? Visit our tour page or contact us for a demo.

Try Kommo free

Discover how Kommo can transform your client management now